
The enrollment data that produces your filings also describes your MEWA: where it is growing, and where it is losing employers faster than it replaces them. Nothing extra is collected to produce it.
Top line numbers tell you whether your MEWA is growing or shrinking. They cannot tell you that one industry has been leaking employers for three quarters, or which counties the growth actually came from, or that 5% growth is actually hiding a 25% churn. Mewa.io’s Market Insights can show you all of this, helping you make targeted marketing and outreach decisions.
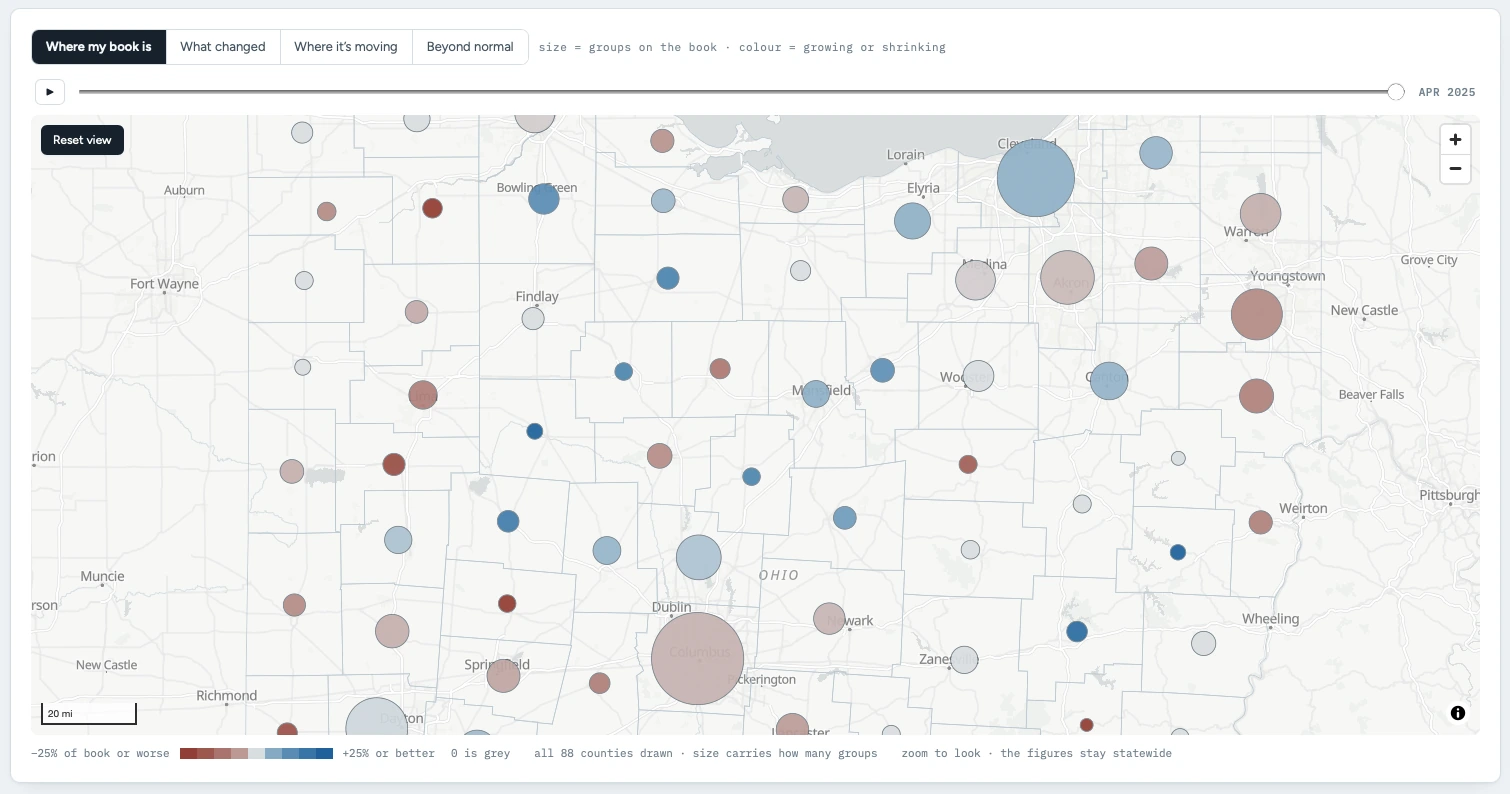
Every participating employer placed by county and by industry code, sized by how many groups sit there. Which parts of your footprint actually hold the employers who join, so recruiting goes where it sticks.
Joins and departures over the period, in the same two cuts. A MEWA can be net positive overall while a region or an industry bleeds out underneath it. In aggregate that’s invisible; by industry code and location it’s obvious, and obvious in month three, not at the annual meeting.
A county or an industry where a handful of employers becomes a run is a signal to lean in early, before it’s obvious to everyone else. The enrollment shows the trend forming while it is still small.
Among the employers that moved, was the split one-sided enough that chance cannot explain it? Each county and industry is measured against what its own number of moves could produce at random. Most of the time nothing falls outside that range – this is the view that catches the cases that do.
Your MEWA is thousands of very small employers, four in five cover fewer than ten lives. No single one is big enough to notice when it joins or leaves; each is just a line in the enrollment feed, carrying its industry code, its location and its size. A year of those lines is the only picture that was ever going to tell you where the plan is growing and where it is shrinking.
Illustrative. 972 joined, 990 left. Not one of those events was large enough to prompt a conversation on its own, and a third of the year's departures landed in December and January.
Growth is concentrated in employers of three to twelve lives in the trades. The transportation panel has been net negative for four consecutive quarters.
There is no separate collection, no quarterly exercise, and nothing in it that a privacy officer has to think about.
It comes from the enrollment data that running the plan already generates: the same records behind the filings, the billing and the covered-lives count. There is nothing new to collect and nothing to keep up to date: once Mewa.io manages your plan, the view is simply there, and current.
What it reads is employer-level and census-level: industry code, location, covered lives, effective and termination dates. It does not read claims, diagnoses or anything else that would make it protected health information. And it describes your own MEWA, not the market as a whole. It can tell you where your employers are concentrated and where they are going, not who never joined.
Your brokers get the same read on their own book, across every MEWA they place on Mewa.io. More on what brokers get →
Employer-level and census-level. Never claims.
Read from the data your plan already generates.
Leave your email and you’ll hear from the person who would manage your account. Much of your book is already a matter of public record, so we can arrive at the first conversation with something to show rather than questions to ask.
Or email us directly.